Navigator performance improvement
Faster load time
When the Navigator was re-written for intervals.icu the organisation of calculations was also overhauled. This improved responsiveness in some areas - all metrics are now available immediately upon activity upload - and added a slight performance penalty in others. The main adverse change has been an increase in the initial load time: some users experienced much higher wait times for the first screen to appear in the new version. This was specific to the behaviour of each browser and it was a time cost incurred before any Navigator code was invoked. This has been fixed. If you now find when launching the Navigator that you are waiting several seconds for the menu bar to appear please let me know.
Improvement to the performance of various aspects of the Navigator is continual and I hope that you will find a trend towards ever snappier experience over the coming weeks and months. If you have feedback on any aspect of system performance, especially if you are fairly sure that it’s not an issue with your own device, please get in touch.
Tech corner (optional!)
If you do find the Navigator is slow to load and you don’t mind digging deeper you can help to isolate where the delay is occurring by using your browser’s developer tools. Here’s how to do it in Chrome on a laptop (I’m using a Mac):
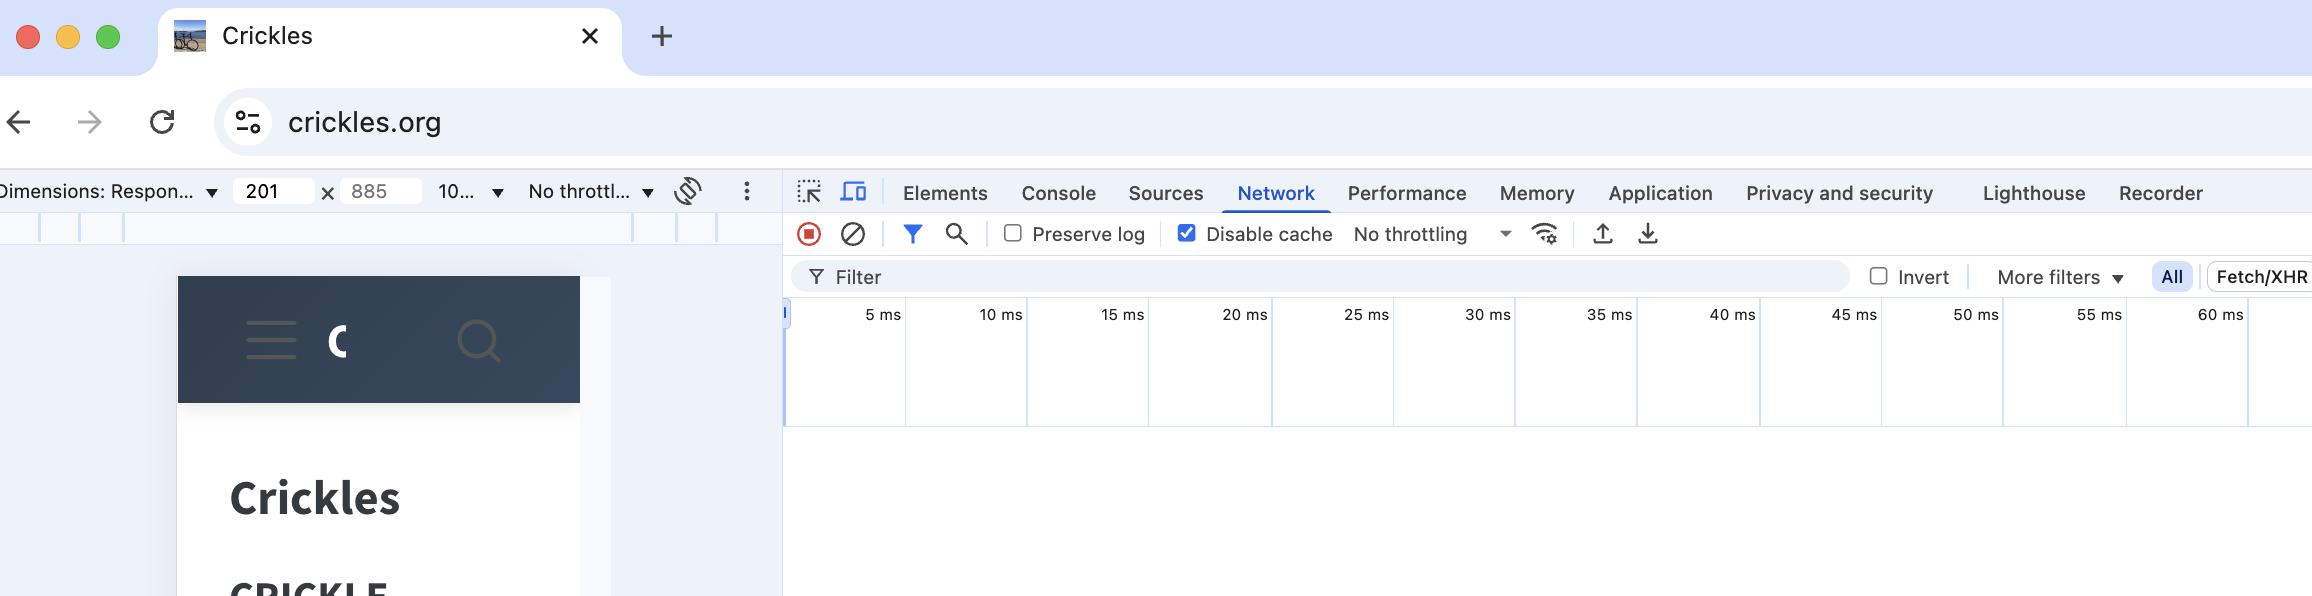
First, go to crickles.org and in the Chrome menu bar find View / Developer / Developer Tools:

When you select this Crickles will be squeezed over to the left and most of your screen will be given over to a developer UI. There’s a new menu running across the top of this beginning Elements Console … From this menu select Network and then check the box called Disable Cache:
Next, move your cursor, which will have changed into a circle, over to the Crickles pull-down menu on the left (the three grey horizontal lines) and select Navigator. You will see activity on the right hand part of the screen as assets are loaded to fetch the Navigator. The top part of the developer UI shows you a load timeline in tiny font. We’re interested in the table underneath that, which shows how long each asset takes to load:
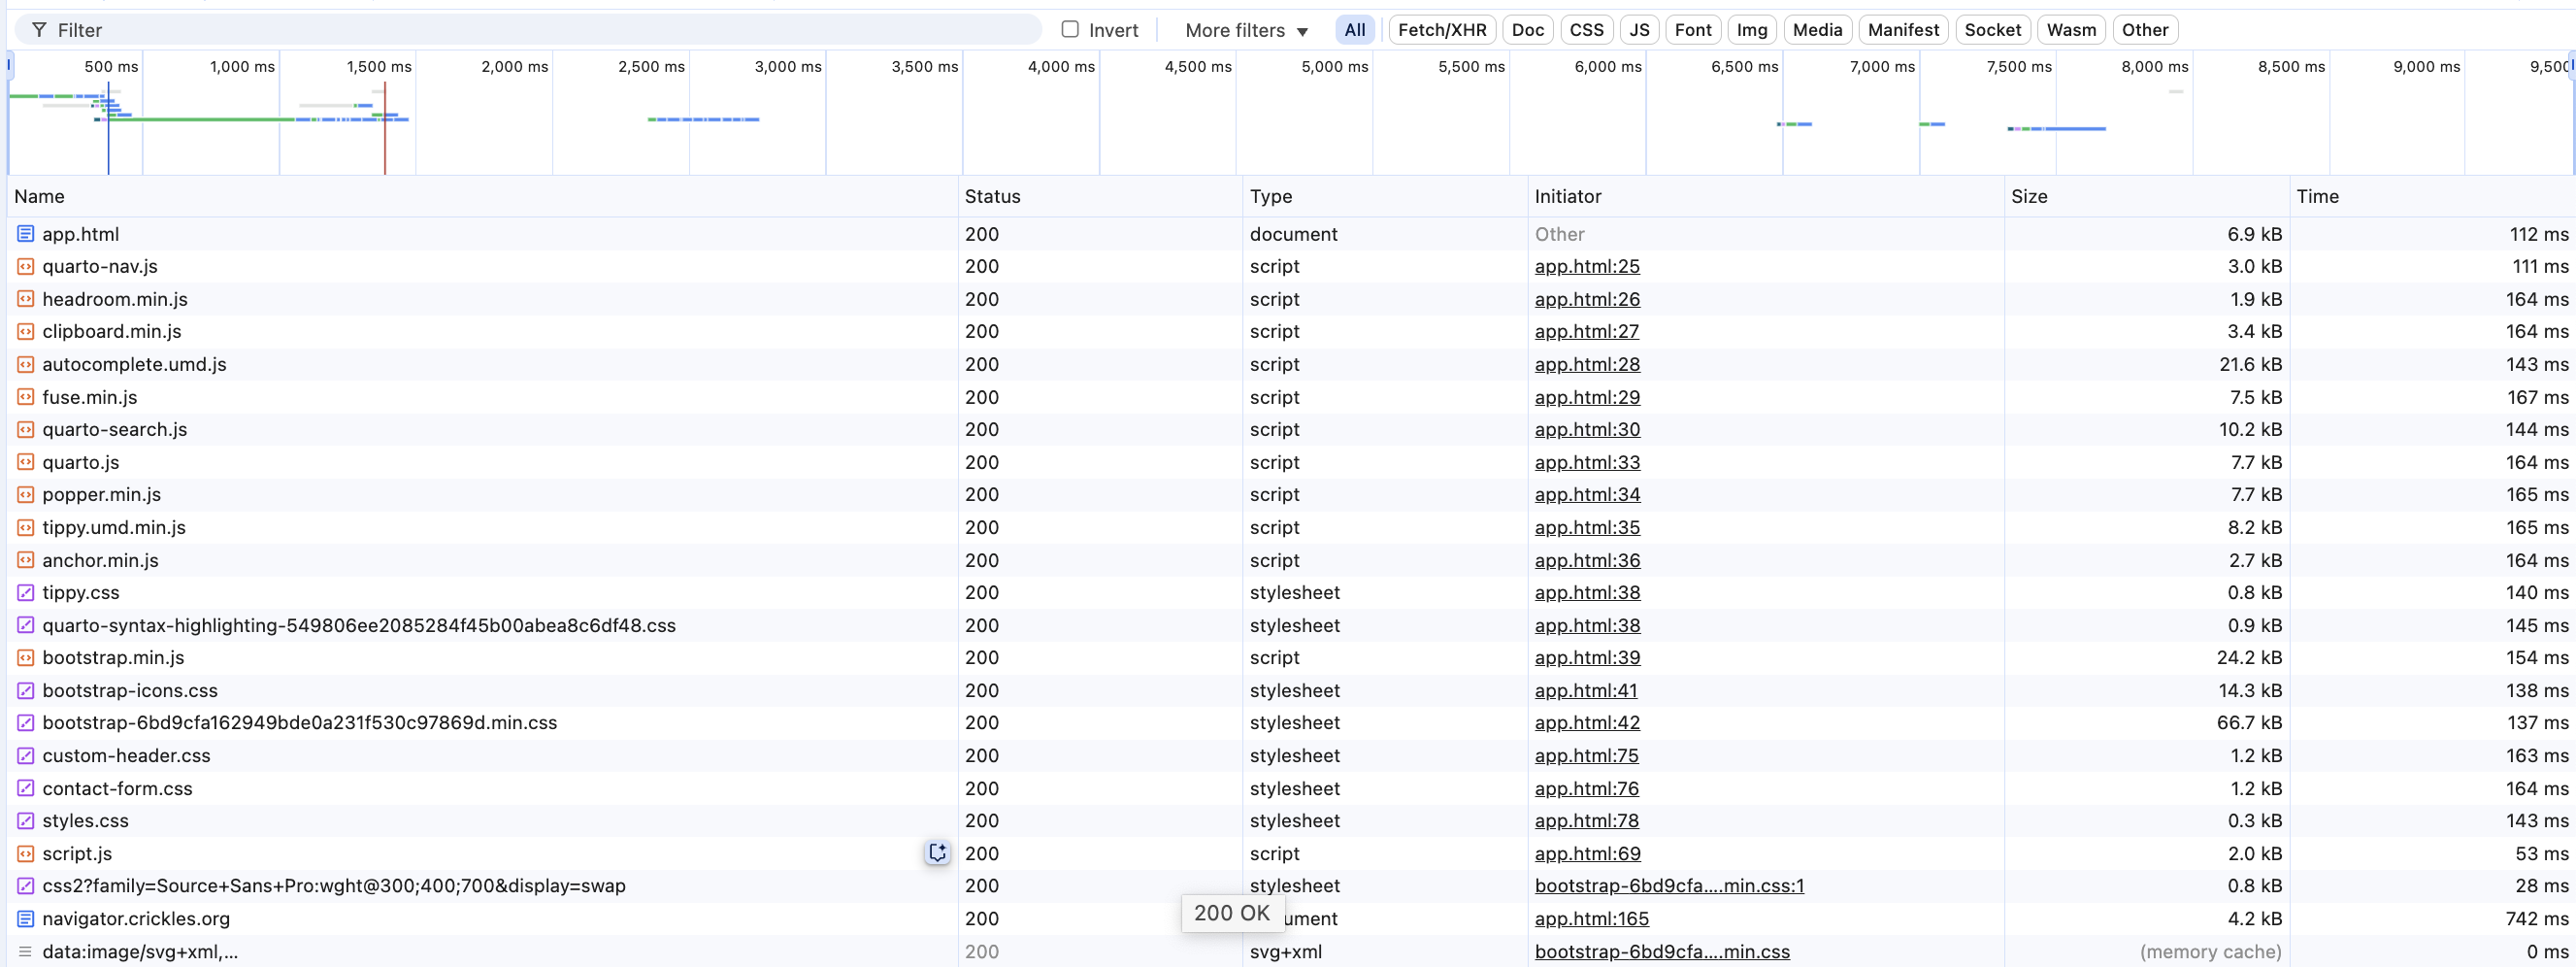
The far right column gives the load time for each asset in milliseconds. At the very top is app.html, the name of the (empty) page in which the Navigator sits - in this example the load time is 112 ms, or about one tenth of a second. This is quite but fast but if instead it were high - in seconds not milliseconds - that would be a problem. We’re also interested in the line further down called navigator.crickles.org, also marked with a blue icon. Here the load time is 742 ms, or about three quarters of a second.
Now, clicking on the navigator.crickles.org label will show new information about that particular line, with its own menu. Clicking on the Timing option shows something like this, giving a more detailed breakdown of the 742 ms shown in the last column on the line above:
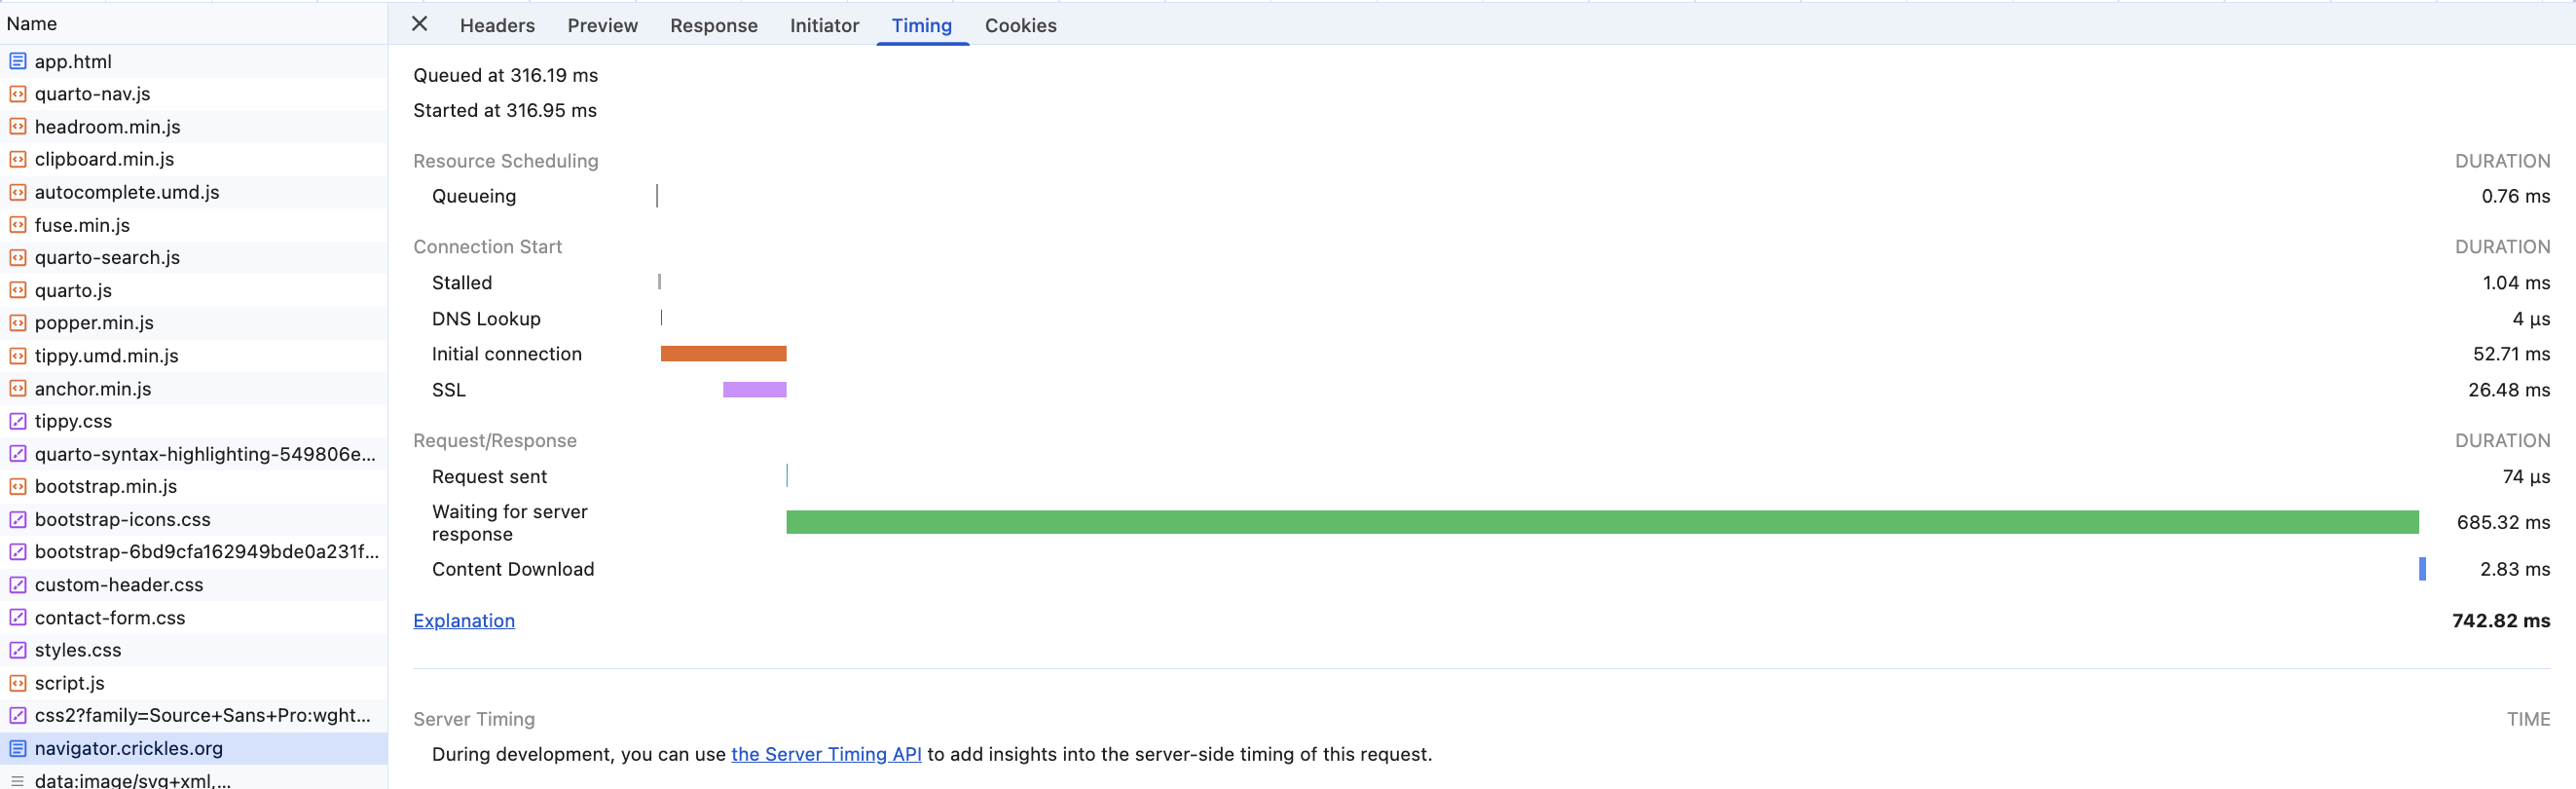
This is the time that passes right before the Navigator starts to fill the screen. From then on Crickles is more directly accountable for screen responsiveness and can be analysed using very detailed application logs that are not available to the user.
If you’re seeing a long load time it’s very helpful to know how much of that is visible in the timings shown in these developer pages. Hold-ups in these “pre application” is harder to track down than poor application performance and information shown above is thus very helpful diagnostically when getting a report of slow load time. To summarise, the two figures that are most useful are the app.html time - 112 ms in this example - and the navigator.crickles.org time - 742 ms here. It’s less likely but if any other individual times are in the thousands of milliseconds that would be useful to know too.